
This report was developed in collaboration with journalists at Reveal, from the Center for Investigative Reporting. Reveal developed the list of larger Silicon Valley technology companies we examine in this report and did a parallel analysis of publicly released diversity numbers for twenty-six prominent Silicon Valley firms. You can learn more about those firms and where they lie on the distributions produced for this report here. The source data for this report come from confidential EEO-1 reports by firms to the U.S. Equal Employment Opportunity Commission. This report has been reviewed by the Commission as to compliance with confidentiality requirements in the 1964 Civil Rights Act. Analyses and findings in this report are the responsibility of the authors and the Center for Employment Equity and do not represent analyses or interpretations of the U.S. Equal Employment Opportunity Commission.
Donald Tomaskovic-Devey & JooHee Han
Overall, we document for the first time considerable variability among firms in their employment diversity. Diversity in Tech is clearly possible now and our results suggest that some firms have already figured out how to do it. We also show that it is possible to develop metrics for evaluating firm’s success or failure relative to their peers. Benchmarking firm success or failure at achieving more diverse workforces is a prerequisite for holding both firms and their management teams accountable as well as increasing transparency to both internal and external stakeholders.
The causes of Tech’s diversity problems are no doubt complex. This does not mean, however, that the solutions need be. Employment diversity is a mathematical result of who gets hired, promoted and retained. To change diversity these three simple factors need to be measured, monitored and managed. Since the internal climates of firms are central to both recruitment and retention, in the end this is what needs to be managed. These firms already know how to develop innovative products, compete in dynamic global markets, hire in competitive labor markets, and are rapidly transforming our world. It’s difficult to come up with a plausible reason why many cannot manage diversity. In this report we show that some firms are diverse, so then the question becomes why some are not.
Key Findings
Large Silicon Valley Tech firms have few women, Black or Latinx employees. The higher the rank of the job the less numerous women and minorities become.
- However, the large firms have more diversity than smaller ones. Relative to smaller Silicon Valley Tech firms White men, Black men, Black women, Latinos, and Latinas are employed at somewhat higher rates in large Tech firms, while Asian men and Asian women are less prevalent. White women are more likely to be in executive positions in these largest firms.
- In large Tech firms Asian men and women are concentrated in technical positions, but are less well represented in manager and executive positions. White women, in contrast, when compared to Asian men and women, are more common in managerial jobs.
- Pipeline explanations are for the lack of Latinx and Black employees not supported.
There is considerable firm level demographic variation across these large Silicon Valley Tech firms.
- In the median firm White male representation is about 41% of all workers, but there are twelve firms where White men are less than a quarter of employees. While more than 80% of executives are White male across all large Silicon Valley firms, White men dip below half of executives in twenty-four firms.
- There are four firms with no Asian men in management and twenty-one where they are absent among top executives. On the other hand, Asian men are more than half of all professionals, managers and executives in seven, five and four firms respectively.
- On average Black men make up less than 1.5% of employees in all three occupations, but twice that in some firms. Black men are more than 3% of executives in sixteen firms. Crossing the 3% threshold for Black men is rarer among managers (fourteen firms) and professionals (nine firms). But there are three firms where Black men are more than 10% of managers. All but seven firms have at least one Black male employee, but 71% have none at the executive ranks.
- In all occupational ranks, the median proportion Latino is less than 3% and firms with no Latino employees in executive jobs are quite common. There are, however, thirteen firms where Latinos comprise more than 5% of executives. Latinos are more than 5% of managers in thirty-six firms and of professionals in twenty.
- There are firms where none of the executives (16 firms, or 9%) or managers (4 firms, or 2.3%) are White women. But in a handful of firms, White women comprise more than 25% of managerial (36 firms), executive (18 firms), and professional jobs (9 firms). White women are more common in managerial jobs than either professional or executive positions.
- Sixty-six firms (37.3%) have no Asian female executives. Seven firms have no Asian women in management. In contrast there are twenty-one firms where Asian women comprise more than 20% of professionals. In twenty-two firms Asian women comprise 15% or more of managers, in only three firms are Asian Women represented at this rate among executives.
- Black women and Latinas are rare in all professional, management and executive jobs. There are, however, a handful of firms where both groups are more than 3% of all of these job groups.
Managerial composition matters for group access to Tech jobs.
- More White men in executive jobs are associated with the employment of fewer Asian men and Asian women in professional jobs
- Conversely, more White women in management jobs are associated with the employment of more professional Black women and Latinas.
Is Silicon Valley Tech Diversity Possible Now?
There is ample evidence that the Tech industry, and particularly Silicon Valley firms, has a diversity and climate problem. Most prominently, the U.S. Equal Employment Opportunity Commission recently reviewed the substantial literature suggesting gender and racial bias in employment in this sector. That report also examined the evidence of the supply of women and underrepresented minorities and concluded that while there may be some limits in the diversity of available labor, there is substantial attrition of women and minorities in post-education access to Tech firms and high rates of turnover once hired. 1
Some of the most direct evidence on the chilly climate in Tech for women comes from the research of Joan Williams and the Center for WorkLife Law, who found that two-thirds of all women and three-quarters of Black women in Tech reported having to prove themselves over and over again. A majority reported co-worker and manager backlash when they did not conform to female stereotypes, and many felt isolated at work and confined by stereotypical views of women’s roles.2 A recent report on “Tech leavers” suggests that unfair and stereotyped treatment is a major and expensive source of turnover for Tech firms.3 Another major report documented that while Asian ancestry workers were a large proportion of the professional Tech workforce, their representation in managerial and executive positions lagged behind that of White men and White women.4
In this report, we ask a set of new questions: Are all of the largest firms in the Northern California Tech sector consistently tilted toward White men? Or is there important firm variation in the ability to recruit and retain a more diverse workforce? Are there firms that demonstrate that diversity is currently possible in Silicon Valley?
Our approach to answering these questions is simple. We take all of the largest Tech firms in the Silicon Valley and San Francisco Bay areas of California and calculate their employment distributions overall, and in executive, managerial, and professional jobs. In the Tech industry it is common for executive and managerial employees to be promoted from professional positions. These three jobs represent the technical as well as leadership labor market in this sector. We draw from data reported to the U.S. Equal Employment Opportunity Commission in 2016 (the most recent data available), which every large workplace is required to submit under the 1964 Civil Rights Act. The source data for this report is confidential and we cannot report the names of specific firms, but we can compare diversity in the large Tech firms to each other as well as to smaller Tech firms in the Silicon Valley area. Our analyses document substantial variation in firm diversity, which indicates that diversity in Tech is possible now. 5
We begin by describing employment diversity in these large Silicon Valley Tech firms and then go on to compare their employment diversity to that in smaller local Tech firms and to national talent pipelines.6 The heart of the report focuses on firm variability in demographic diversity among large Silicon Valley Tech firms. We conclude by exploring the limited potential of leadership diversity, and the larger opportunities associated with accountability, transparency, and diversity metrics to promote increased diversity and welcoming organizational climates in Tech.
Gender and Racial Diversity in Tech
Table 1 reports the gender and race composition of the population of large Silicon Valley Tech firms. Male workers, particularly White and Asian men, dominate Silicon Valley Tech firms. This is true among executives, managers and the core technical workforce as well. African American and Latinx employees are much fewer in number. In most workplaces there are very few African Americans, Latinos, or women.
About 70% of total managerial and professionals in large Silicon Valley Tech firms are men. Executives, the people with power to change firm policy and make capital investment decisions, are even more likely to be men (79%). White men are the most common group, holding 38.7% of professional jobs, 46.5% of management positions, and 58.7% of executive jobs. Asian men are the next most common, employed in 25.9% of professional positions, 17.9% of managers, and 16.3% of executives. Black men and Latinos are rare. Black men are only 1.8% of professionals, 1.5% of managers, and only 1 among 100 executives. There are slightly more Latinos in these large Tech firms than Black men. But their numbers are also quite low: 3.4% of professionals, 3.6% of managers, and 2.1% of executives are Latinx. White women are only 13.8% of professionals but are more common among managers (18.2%) and among executives (14.6%)
White women are actually slightly more common among managers than Asian men, and almost as large a component of the executive ranks. This pattern suggests that once they gain access to Tech firms White women have promotion or lateral hiring advantages over Asian men in access to authority invested jobs. The pattern for Asian women is quite the reverse. They make up 11.6% of Tech professionals, 7.8% of managers, and only 4.5% of executives. Asian men and women are prominent in professional roles, but much less so in managerial and especially executive roles.7 There appears to be a pipeline into executive jobs that favors White men, another that leads Asian men and women into professional positions but is blocked in terms of upward mobility, and still another one that diverts White women from professional and into managerial, but not executive jobs.
Table 1. Gender/Race Shares of Employment in Percent, 177 Largest Silicon Valley Tech Firms.

Note: Because Native Americans and Multi-racial groups are not presented in the table but included in the total number of employees the sum of each race is not 100%.
Latinas and Black women are quite rare in these large Silicon Valley Tech firms, making up only 2.4% and 1.8% of all workers. Minority women, when employed in these firms are most common in lower level jobs, followed by professional occupations which are 1.6% Latina and 1.1% Black women. Both groups are vanishingly rare in the executive ranks.
How Do Large Silicon Valley Tech Firms Compare to Small Tech in teh Same Region?
We also compared the employment pattern in these 177 large Silicon Valley area Tech firms to 1,277 workplaces associated with smaller Tech firms in the same region.8 Figure 1 reports these comparisons. We wondered if large Tech firms, perhaps because they are under more intense external scrutiny for their diversity outcomes, do better than smaller Tech firms who are recruiting their labor from the same skill pool. In general, employment composition is relatively similar in the largest and smaller Tech firms.
Figure 1. Percent Surplus/Deficit of Each Demographic Group in Large Silicon Valley Tech Firms -Relative to Smaller Silicon Valley Tech Firms
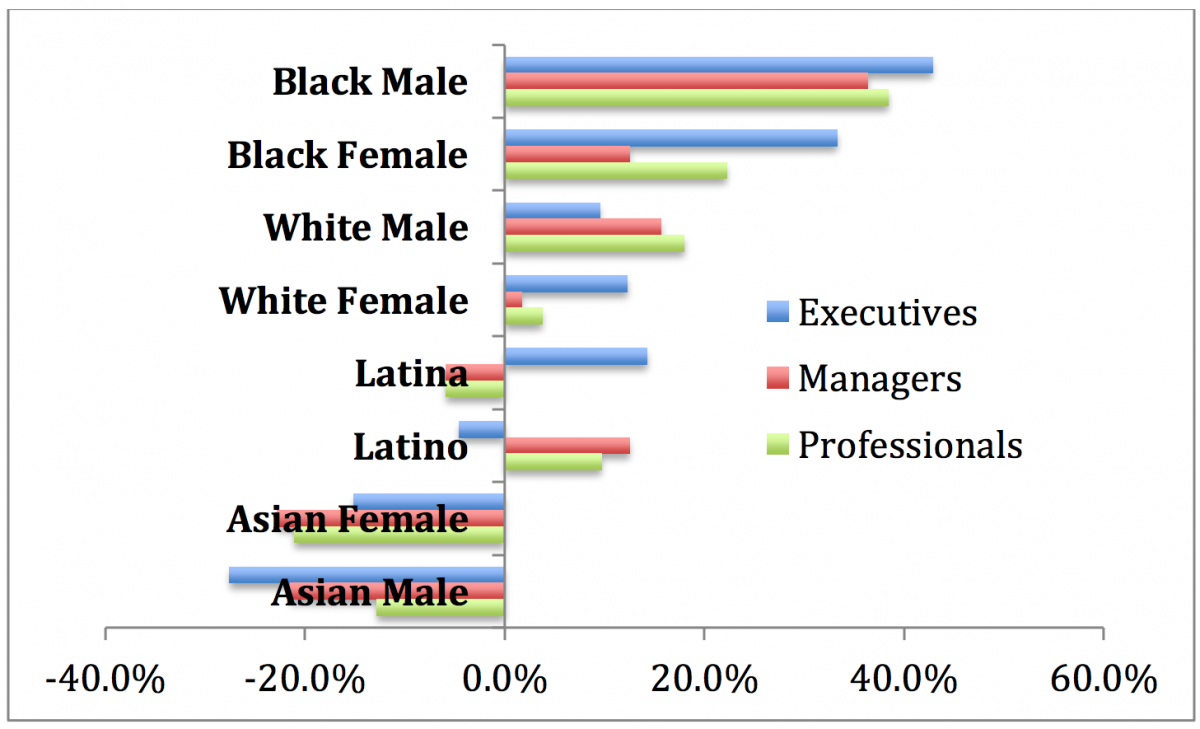
Note: These statistics are calculated as the ratio of each occupation/demographic group in large Tech firms to their representation in smaller Tech private sector firms in the San Jose– San Francisco–Oakland, CA Combined Statistical Area.
We start with the bad news: White men are more likely to be employed by larger Tech firms than smaller Tech firms, and this is particularly the case for professional occupations. But, there is also some good news. Black men and women, while still numerically quite rare, are much more likely to be found in the large Tech firms than in smaller firms. This pattern is particularly pronounced among professional and executive jobs. White women and Latinas are more common in executive jobs in large Tech, while Latinos are more common in management and professional roles. This suggests that among these largest Silicon Valley firms, at least some are better at hiring or retaining diverse workforces, particularly in managerial and executive roles, than the much more numerous smaller Tech firms in the area.
In striking contrast, Asian men and women are more commonly employed in the smaller Tech firms in all three occupations. In contrast to prior research which documents Asian employment advantages in large Silicon Valley Tech firms, our results suggest the opposite conclusion relative to the local labor supply. Compared to other tech firms in the region Asian men and women have consistently lower access to these largest Tech firms and their often lucrative jobs.
How Do Large Silicon Valley Tech Firms Compare to the National Supply of Tech Workers?
A common explanation for the low diversity in Tech firms is that there is a pipeline problem. There simply are not enough women or minority workers to hire into these technically demanding jobs. The EEOC report referenced above suggests that this may be a problem, but that it is far from a complete explanation. Compellingly, a recent U.S. General Accountability Office report showed that 57% of employees in tech occupations were actually employed outside of Tech industry firms.9 The majority of programmers, systems analysts and other coders work in information intensive industries, like banking and universities, and in support roles in larger firms of all kinds. This suggests that the available labor force that these leading Tech firms could recruit from is quite large.
The pipeline explanation is particularly suspect for Black and Latinx workers. The GAO estimated for 2015 that African Americans were 7.5% and Latinx 7.7% of tech professional employees outside of the tech industry. In the large Silicon Valley tech firms we are examining here African Americans are only 2.9% of professional workers. Latinx are 5% of professionals in these firms. If there is a pipeline problem for Blacks and Latinx, it may simply be the failure to build the pipe.
The picture is different for women as a group. Their representation in professional jobs in these large Tech firms (29%) is somewhat higher that the GAO estimate of their availability in national tech occupations (25%), although this small difference probably represents the EEOC’s inclusion of all professionals, not just technology professionals, in the EEOC’s professional occupational group. The reports of chilly climates, sexual and general harassment, failure to train and promote, and the resulting high turnover among women in these firms suggest that the problem is in the management of the firms themselves. The degree to which gender diversity is effectively managed is likely to be reflected also in variation between firms in their gender diversity.
Is Demographic Diversity Possible Now in These Large Silicon Valley Tech Firms?
In the remainder of this report we examine the extent to which large Silicon Valley firms deviate from these average patterns. One can think of this exercise as answering a pressing question for these firms, employment equity advocates, and regulators: Is demographic diversity already possible in large Silicon Valley Tech firms?
We approach this question by examining the actual distributions of employment in executive, managerial and professional jobs in the population of 177 large Technology firms in the San Francisco/Silicon Valley labor market. These distributions can be accessed at Github and any Silicon Valley Tech firm can use them to benchmark their diversity relative to this group of large Tech firms.10
Figure 2. Density Plots of Male Employment Distributions for Executives, Managers, and Professionals Employment in 177 Large Silicon Valley Tech Firms.
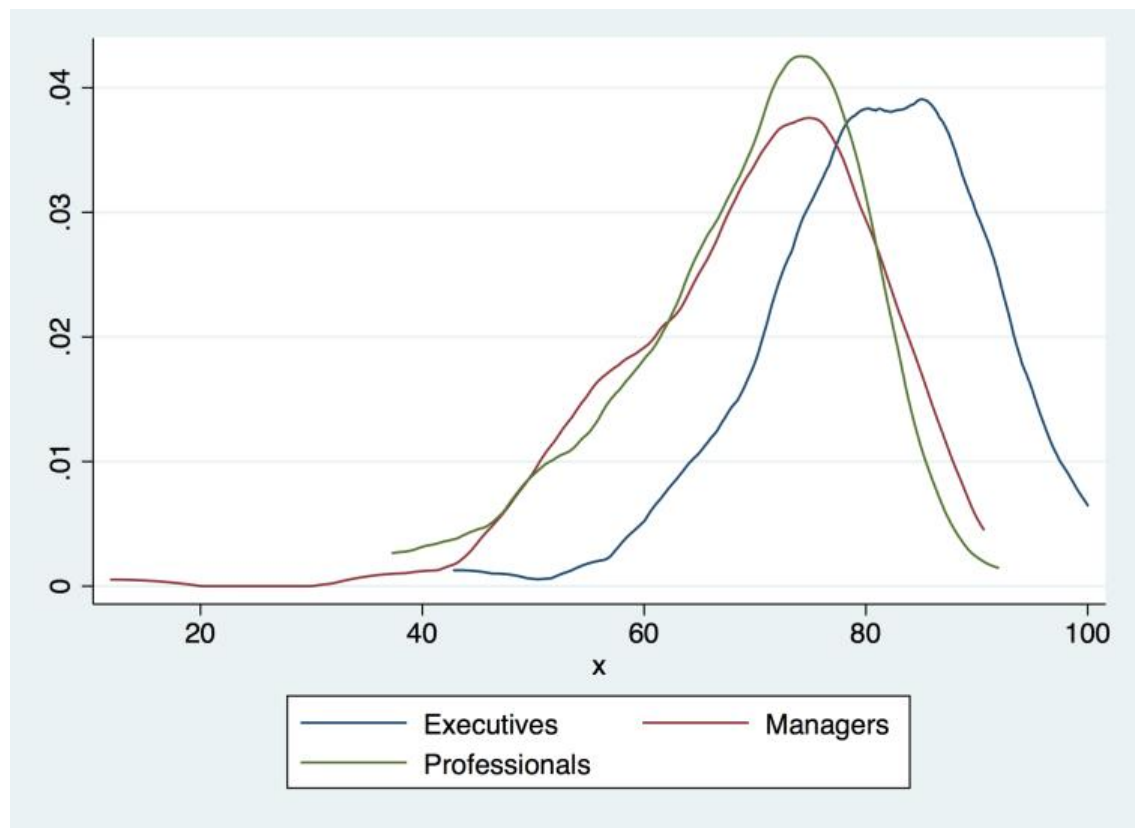
Note: These density plots visualize a smoothed distribution of employment over the 177 firms. The peak displays where values are concentrated over the distribution. The horizontal-axis is the percent of men (x) in each occupation. The vertical-axis is the percentage of the total number of firms at each x-values out of the population of 177 firms
Figure 2 displays the variation in male employment across Silicon Valley Tech firms. As we have already seen, men tend to be employed at higher rates than women, but in some firms women are actually a majority of employees. As we documented in the previous section, the higher up the occupational ladder we go in these firms the more numerous men tend to be. At the same time, for each distribution of employee groups across this population of Silicon Valley Tech firms, there are firms that are more than 50% women, even among executives. Conversely, there are firms in which all executives are men, and many where more than 80% of managers and professionals are men. Some firms are clearly better and others worse at hiring and retaining women. Some are almost entirely male.
Tech Firm Diversity Among Men
Although White and Asian men dominate these Tech firms, the degree of diversity varies markedly across gender/racial groups and occupations. Higher employment diversity is not an impossible achievement. The top left box-plot in Figure 3 shows the distribution of White men in these 177 firms. The median White male representation is about 41% of all workers, but there are ten firms where White men are more than 55% of employees and twelve where White men comprise less than 25%. Diversity is possible in big Tech firms.
Figure 3. Box Plots of Male Representation for Whites, Asians, Blacks, and Latinos in Total, Executive, Manager, and Professional Employment.

A box plot shows a central box banded at the 25th and 75th percentile of firms, a line for the median is in the middle of the box, lines for the upper and lower bounds within a normal distribution, dots represent statistically outlier firms.
Among executives, the median proportion of White men is higher than 60%. Nonetheless, there is diversity in White male representation here as well. More than 80% of executives are White male in eleven firms. In contrast, White men comprise less than 50% of executives in twenty-four firms. The distribution of White men in professional jobs across firms looks quite similar to their distribution across all jobs, in some firms almost all professionals are White men, in others White men are a small minority of professional workers. Managerial distributions are in-between the professional and executive patterns, with some firm’s management teams above 75% White men, and others below 20%.
Asian male representation (top right in Figure 3) shows a different pattern. Asian male employment is largest in professional jobs, but managerial employment is substantially lower on average than in professional roles. There are even firms with no Asian men in managerial (4 firms, 2.3%) and executive jobs (21 firms, 11.9%). On the other hand, Asian men comprise more than 50% of these jobs in some firms (executive jobs in 4 firms; managerial jobs in 5 firms; and professional jobs in 7 firms). Compared to White men Asian men have similar representation in the core technical jobs, become increasingly scarce in managerial and executive jobs, but also display a great deal of employment variation across firms.
Black men (bottom left in Figure 3) are very rare in all occupations in these Tech firms, particularly when compared to White and Asian men. The median proportion of Black men in total employment, as well as professional and managerial jobs is below 3%. They are even rarer in the executive ranks with most firms (125 firms, 70.6%) having no Black male executives. Across all occupations, there are seven firms with no Black men at all. However, like White and Asian male representation, there is firm variation in Black male representation. Although rare, there are 16 firms where Black men comprise more than 3% of executives, managers (14 firms), and professionals (9 firms). There are even three firms where Black men are more than 10% of managers.
The Latino representation (bottom right in Figure 3) pattern is similar to Black men. In all occupational ranks, median proportion of Latino is less than 5% and firms with no Latino employees in executive jobs are statistically quite common. There are, however, 13 firms where Latinos comprise more than 5% of executives. Latinos are more than 5% of managers in 36 firms and of professionals in 20 firms.
Tech Firm Diversity Among Women
Like men, women’s employment patterns also show considerable firm specific variation. Not surprisingly, White female representation (top left in Figure 4) is quite a bit different from White men’s representation (top left in Figure 3). The median firm’s proportion of White women is about 15%. In addition, there are firms where none of the executives (16 firms, 9%) or managers (4 firms, 2.3%) are White female at all. In 18 firms, White women are more than 25% of executives, managerial jobs in 36 firms, and professional jobs in 9 firms. White women are more common in managerial jobs than either professional or executive positions.
Asian female representation (top right in Figure 4) follows a pattern similar to Asian men. The proportion of Asian women is the largest in the professional rank but decreases in the managerial rank and is quite low among executives. There are firms with no Asian women managers (7 firms, 4.0%). Many (66, 37.3%) firms have no Asian women executives at all. Again, there are also firms that do better. In 21 firms Asian women are more than 20% of all professionals. In 22 firms, Asian women are 15% or more of managers. In only three firms are Asian women 15% or more of executives.
Figure 4. Box Plots of Female Representation for Whites, Asians, Blacks, and Latinas in Total, Executive, Manager, and Professional Employment.

Note: A box plot shows a central box banded at the 25th and 75th percentile of firms, a line for the median is in the middle of the box, lines for the upper and lower bounds within a normal distribution, dots represent statistically outlier firms.
Like Black men, Black women are rarely employed in these large Silicon Valley Tech firms (bottom left in Figure 4). There are ten firms (5.7%) with no Black women at all. The median proportion of Black women is close to zero in all firms. Unlike the other groups, Black women are so rare in Tech that it is difficult to observe much variability in their employment across these firms. There are a very few exceptions to this rule. In eleven firms, Black women are more than 3% of professionals. In four firms Black women are above 3% of executives.
Average Latina representation is slightly higher than Black women (bottom right in Figure 4). Yet, Latina representation is still quite low. There are two firms (1.1%) with no Latina employees. At the same time, there are ten firms in which Latinas comprise more than 3% of executives, and twenty-eight and twenty-two firms in which Latinas rise above 3% of managers and professionals respectively. There are even five firms in which Latina comprise more than 5% of executives. More than token representation of Black and Latina women in larger Silicon Valley Tech firms is possible, but also quite rare.
Does Leadership Diversity Matter?
We were also interested in investigating if the composition of firm leadership matters for diversity. Many advocacy organizations have promoted increased executive and managerial diversity as a mechanism to increase diversity among employees more generally. Empirical studies have found mixed support for this relationship, although quite a few studies find a positive relationship between leadership diversity and more general diversity.11
In order to do this analysis, we first standardized employment in each firm relative to the available labor pool across all of these 177 Tech firms. We create a representation ratio (RR) for each firm and occupation that allows us to compare firm diversity relative to the current workforce in these large Tech firms.12
For example, to calculate the White Male Representation Ratio, each firm’s White male proportion is divided by the mean White male proportion across the 177 firms. RRiWhite Male indicates firm i’s White male proportion relative to the mean White male proportion in the 177 firms. A value of one (1) indicates that the firm’s proportion is identical to the mean of all firms. Values larger than 1 mean that the firm’s White male proportion is larger than the average proportion of White men in these 177 firms. Values less than 1 mean that the firm’s White male proportion is smaller than the average firm. We create a RR for each demographic group in each occupation for each firm.
For most comparisons, there are no statistically significant correlations between executive or managerial demographic composition and the representation of other groups in lower level jobs.
We find little support that diversity among executives generally leads to more diversity in the entire firm, although we do find two interesting instances where it may be happening. Figure 5 reports the first of these. We find that in firms with relatively more White male executives, there are relatively fewer Asian females in both managerial and professional jobs. White male executive leadership may tend to produce negative impacts on Asian Female hiring in lower rank jobs.
Figure 5. Correlations between White Male Executive Representation and Asian Female Representations in Managers and Professionals, 177 large Silicon Valley Firms. (1=mean representation of each demographic group across 177 firms)

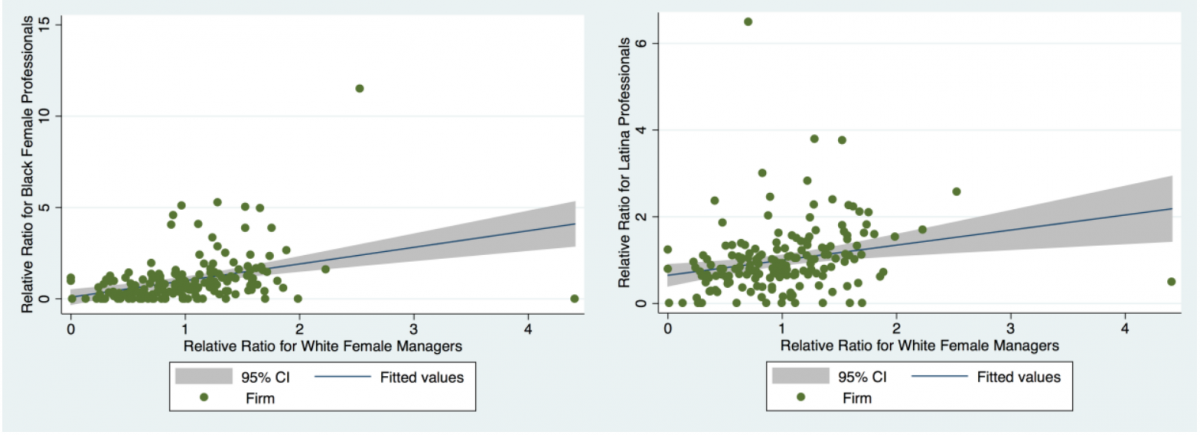
There was a second statistically significant set of correlations, this time between White female managerial composition and professional employment diversity. We find that in firms with more White female managers, the relative proportion of Black female professionals is larger (left in Figure 6). We find a similar relationship between White female managerial representation and Latina professional employment (right in Figure 6). White female representation tends to co-occur with, and might even promote, higher employment of under-represented minority women.
Figure 6. Correlations between White Female Managerial Representation and Black and Latina Representations in Professional Jobs, 177 large Silicon Valley Firms. (1=mean representation of each demographic group across 177 firms)
Toward Increased Diversity in Tech
Despite the overwhelming critical narrative focusing on the industry’s lack of diversity, some Silicon Valley Tech firms appear to have successfully achieved demographically diverse workforces. Firms exist now with substantial racial and gender integration in their professional workforces. Fewer, but still some, have done the same in their managerial and executive ranks. Compared to smaller Tech firms in the Silicon Valley labor market, larger Tech firms employ a higher proportion of Black men, Black women, Latinas, and White women in executive jobs. For Black men and Black women this more favorable profile extends down the ranks to both manager and professional employment as well.
While our demographic estimates do not provide a recipe as to how successful diversity happens, there are a few hints. More White women in managerial positions tends to be associated with more Latina and Black women in professional roles. Conversely, fewer White men in executive jobs might lead to more Asian women in managerial and professional roles. Our results suggest that the demographic composition of firm leadership can be influential, but also that it generally is not. More African Americans or Latinx in managerial or executive positions are not associated with further hiring or retention from those or other groups. Leadership diversity, at least if it is at very low levels, is not sufficient to diversify Tech employment. It may be the case that a critical mass of managers from underrepresented groups is necessary before any group develops an influential voice to promote further gains in diversity. More generally, minority or female management cannot carry this responsibility alone.
One promising avenue for firms attempting to embrace diversity may be to look at the more successful firms and figure out what it is that they are doing right. Past research on diversity in other industries points toward a set of steps that tend to work. These include especialy managerial investment in and accountability for both recruitment and retention of underrepresented groups. 13
But accountability requires metrics. Since the diversity problem in Tech is about both recruitment and retention, metrics on both are needed to assess whether the problem is one of finding the right workers or keeping them once hired. Every firm needs to be keeping track, levels and trends must be transparent to all stakeholders, and management teams must be held accountable. Accountability for diversity must be mainstreamed into managerial jobs.
The most effective firms engage people to work for diversity and be recognized as team players for doing so. Past research is clear diversity training to reduce bias, the remedy of choice in Silicon Valley and much of the US, generally does not change behavior.14 Conversely, increased workplace diversity within jobs leads to increased equal status cross-race and -gender contact, which in turn tends to reduce behavioral and cognitive bias.15 If you want to warm the chilly climate in Tech workplaces, you have to hire and retain more women and minorities and employ them at all levels of the firm. It’s as simple as that.
Once metrics are adopted, transparency in their levels is also important. In the absence of transparency about what is working and what is not, it becomes challenging for top executives, employees, regulators, advocacy groups and the media to effectively pressure firms to improve. The recent report by Reveal, which focuses on the large Silicon Valley Tech firms that have publicly released their diversity numbers, is an important step in that direction.
Since we now know that some firms are doing much better than others it is also possible for firms to combine transparency with accountability by benchmarking their progress relative to their peers.
This report was developed in collaboration with journalists at Reveal, from the Center for Investigative Reporting. Reveal developed the list of larger Silicon Valley technology companies we examine in this report and did a parallel analysis of publicly released diversity numbers for twenty-six prominent Silicon Valley firms. You can learn more about those firms and where they lie on the distributions produced for this report here. The source data for this report come from confidential EEO-1 reports by firms to the U.S. Equal Employment Opportunity Commission. This report has been reviewed by the Commission as to compliance with confidentiality requirements in the 1964 Civil Rights Act. Analyses and findings in this report are the responsibility of the authors and the Center for Employment Equity and do not represent analyses or interpretations of the U.S. Equal Employment Opportunity Commission.
SOURCES:
1 The notoriety of the Tech industry has led to investigations by both the U.S. Equal Employment Opportunity Commission (U.S. Equal Employment Opportunity Commission. 2016. Diversity in High Tech) and the Federal Governmental Accountability Office (United States Government Accountability Office. 2017. Report to the Ranking Member, Committee on Education and the Workforce, House of Representatives: Diversity in the Technology Sector: Federal Agencies Could Improve Oversight of Equal Employment Opportunity Requirements. November 2017 GAO-18-69).
2 Joan C. Williams. “The 5 Biases Pushing Women Out of STEM.” Harvard Business Review March 24, 2015.
3 “The 2017 Tech Leavers Study.” Kapor Center for Social Impact. https://www.kaporcenter.org/tech-leavers/
4 Buck Gee and Denise Peck. “The Illusion of Asian Success: Scant Progress for Minorities Cracking the Glass Ceiling, 2007-2015. 2016.
5 Detailed discussions of methodology and the underlying EEO-1 data are presented in Appendix 1. 6 We define the comparison geography for both of these samples as the San Jose–San Francisco– Oakland, CA Combined Statistical Area. We then focus on firm variation in employee diversity in these large Silicon Valley Tech firms.
6 We define the comparison geography for both of these samples as the San Jose–San Francisco– Oakland, CA Combined Statistical Area. We then focus on firm variation in employee diversity in these large Silicon Valley Tech firms.
7 This pattern was recognized in an earlier study by Gee and Peck, see footnote 3. It is not possible from these data to distinguish between promotions and lateral external hires into managerial jobs. Recent research on the career histories of tech professionals by Sharla Alegria suggests that Asian women are more typically confined to narrow technical specialties and that White women are preferred for managerial promotions over both Asian men and women. Alegria’s research (see footnote 13) suggests that White women more often get access to “translational” rather than authority invested managerial roles (Sharla Alegria, 2016. A Mixed Methods Analysis of the Intersections of Gender, Race, and Migration in the High-tech Workforce. Ph.D. Dissertation University of Massachusetts, Amherst.)
8 Appendix 4 outlines our procedure for drawing this sample of smaller Tech firms.
9 United States Government Accountability Office. 2017. Report to the Ranking Member, Committee on Education and the Workforce, House of Representatives: Diversity in the Technology Sector: Federal Agencies Could Improve Oversight of Equal Employment Opportunity Requirements. November 2017 GAO-18-69.
10 Reveal in their companion reporting of Silicon Valley Tech diversity used these same distributions and have posted them at this site: https://github.com/cirlabs/Silicon-ValleyDiversity-Data.
11 See for example the discussion in Kevin Stainback, Donald Tomaskovic-Devey, and Sheryl Skaggs. "Organizational approaches to inequality: Inertia, relative power, and environments." Annual Review of Sociology 36 (2010).
12 The representation ratio is defined as RRido=Percentido/mean percentdo, Where i=firms; d=demographic groups; and o=occupations.
13 Kevin Stainback, and Donald Tomaskovic-Devey. Documenting desegregation: Racial and gender segregation in private sector employment since the Civil Rights Act (Russell Sage, 2012).
14 See Frank Dobbin and Alexandra Kalev. "Why diversity programs fail." Harvard Business Review (2016) for a summary of this research.
15 This research is summarized in Thomas Pettigrew and Linda Tropp. "A meta-analytic test of intergroup contact theory." Journal of personality and social psychology. 90, no. 5 (2006): 751.
16 In 2014, the EEOC released a special report, Diversity in High Tech, examining EEO-1 private sector diversity reports from 2014. Focusing on 75 of the largest Tech firms in the Silicon Valley region as identified by the San Jose Mercury News as the top high Tech firms in terms of revenue and profitability in the Silicon Valley area. Our approach is similar, although we are more inclusive in our definition of leading firms.
17 Firms that were acquired by other firms during 2016 or 2017 were excluded. The complete firm list we sampled from is provided in the Appendix 2.
18 Our comparisons of EEO-1 representativeness across all firms in 2015 to Bureau of Economic Analysis estimates suggest that this survey is of very high quality and approaches population saturation.
19 Thirty-three of the firms listed in the Appendix 2 did not file with the EEOC in 2016. The missing firms may have been exempt from reporting because they were below the federally required reporting threshold of 100 employees or may have failed to report for other reasons. While completing this research we learned that one firm’s EEOC report was erroneous. We dropped that firm from our sample, leaving 177 large Silicon Valley area Tech firms as our analysis sample.
20 The EEO-1 surveys report demographic composition by 10 occupational groups: Executives, Managers, Professionals, Technicians, Sales, Office and Clerical, Skilled Craft, Operatives, Laborers, Service.
21 The EEOC survey asks for counts of all professionals and so includes, in addition, to the core Tech workers, other professionals such as accountants and lawyers that may be on staff. Most Tech firms outsource these jobs, and so this likely has a limited impact on our findings. See Appendix 3 for the EEOC definitions of these occupational categories.
22 The Latinx category is given priority in the instructions given to firms. Thus all other categories are treated as Non-Latino. The other race/ethnic groups were too small to analyze in this sample. Appendix 3 also report the EEO-1 race/ethnic definitions.